Console de surveillance WebADM
Caractéristiques d'OpenOTP
WebADM Console de surveillance
Le mode Console de surveillance WebADM donne aux administrateurs une vue centralisée et en temps réel de leur environnement WebADM, y compris activité d'authentification, état de la plateforme, disponibilité des connecteurs, journaux, alertes, licences et métriques de service. Il aide les équipes à comprendre rapidement l'état du système, à détecter les problèmes et à surveiller les performances globales de l'infrastructure depuis un tableau de bord unique .
Console de surveillance WebADM
Surveillance centralisée en temps réel pour WebADM
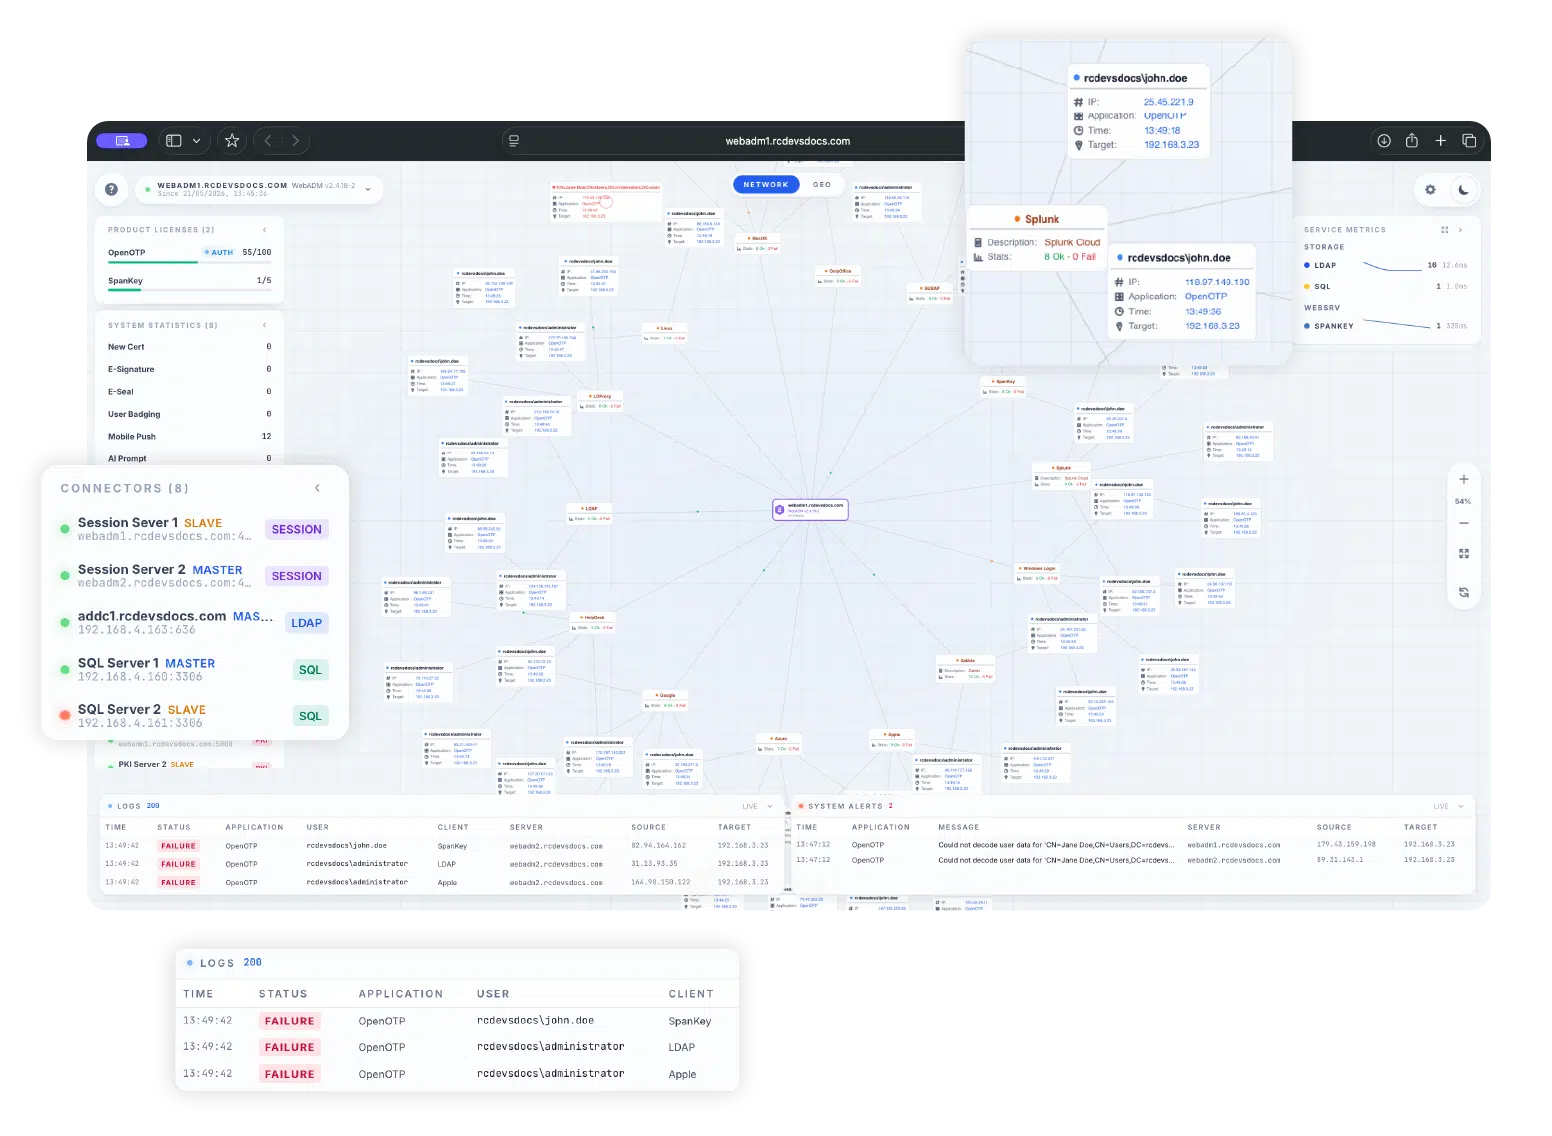
Authentification en direct Activité
Suivez l'activité de connexion sur les systèmes intégrés et visualisez les flux d'authentification au fur et à mesure qu'ils se déroulent. La console aide les administrateurs à comprendre d'où proviennent les demandes d'authentification et comment elles sont traitées dans l'environnement WebADM.
Licence Visibilité
Visualisez l'utilisation actuelle par rapport à la capacité de licence pour les produits WebADM tels que OpenOTP et SpanKey, aidant ainsi les administrateurs à suivre la consommation de produits depuis l'interface de surveillance.
Journaux et Alertes
Affichez les événements d’authentification récents et les alertes actives de la plateforme directement dans la console. Les administrateurs peuvent examiner les détails des événements tels que l’horodatage, le statut, l’application, l’utilisateur, le client, le serveur, l’adresse IP source et la cible.
Système Statistiques
Accéder aux compteurs opérationnels pour l'activité de la plateforme, y compris les certificats, les signatures électroniques, les sceaux électroniques, les notifications push mobiles, l'activité SMS, l'identification des utilisateurs, les rapports IA et les services WebADM associés.
Statut du connecteur Surveillance
Surveillez l'état des backends et des connecteurs configurés, notamment des serveurs de session, des annuaires LDAP, des bases de données SQL, des connecteurs SMTP, PKI et Proxy. Les indicateurs d'état facilitent l'identification des composants indisponibles ou dégradés.
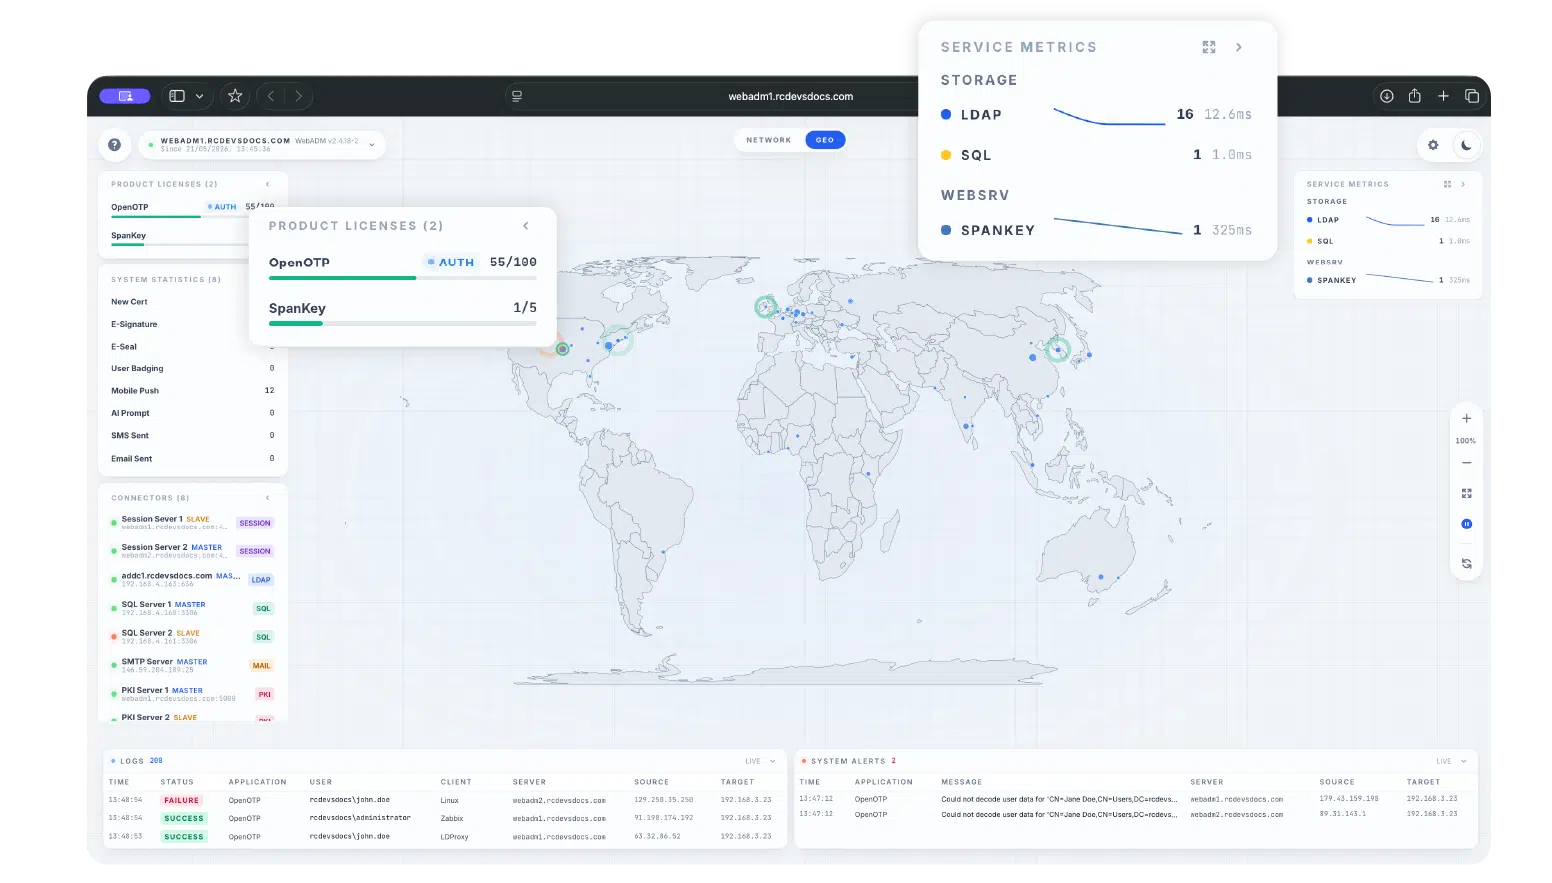
Service Métriques
Suivre les statistiques de latence et de débit pour les backends OpenOTP, SpanKey, LDAP et SQL afin de mieux comprendre les performances du service et la réactivité du backend.
Démarrer la surveillance de votre environnement WebADM En temps réel
Utilisez la console de surveillance WebADM pour centraliser la visibilité de l'activité d'authentification, de l'état du système, des connecteurs, des journaux, des alertes, des licences et des métriques de service.
Accès sécurisé par conception
La console de surveillance est désactivée par défaut et doit être activée explicitement en configurant l'accès à la console tokens dans le fichier de configuration WebADM.
Lorsqu'on y accède directement, la console exige une authentification token avant de se connecter au flux de surveillance.
Les administrateurs doivent traiter les codes d'accès à la console tokens comme des informations confidentielles, les renouveler régulièrement et limiter l'accès à /console/* aux seuls réseaux de gestion fiables.
Questions clés répondues
Qu'est-ce que la console de surveillance WebADM ?
Quelle version de WebADM inclut la console de surveillance ?
La Console de surveillance est-elle activée par défaut ?
Quels services peuvent être surveillés ?
La console peut-elle afficher une activité de connexion géographique ?
Dois-je être connecté à WebADM pour accéder à la console de surveillance ?
La preuve
par l'expérience.
Que vous achetiez une voiture ou une solution de sécurité, vous souhaitez toujours la tester avant de signer sur la ligne pointillée. Nous le savons et vous le savez.
Contactez-nous pour votre PoC gratuit ou testez par vous-même.