

Console de surveillance WebADM : finies les recherches, place à la surveillance !
Console de surveillance WebADM : Arrêtez de chercher et commencez à surveiller
L'infrastructure d'authentification a le don de rester invisible, jusqu'à ce qu'un connecteur tombe en panne, qu'un backend ralentisse considérablement ou que des tentatives de connexion échouées commencent à apparaître à un endroit inattendu.
À ce moment-là, personne ne veut d'une chasse au trésor à travers des pages de statut, des fichiers journaux et des onglets de navigateur.
Le mode Console de surveillance WebADM cela change. Il apporte une activité d'authentification en direct, l'état de la plateforme, la disponibilité des connecteurs, les journaux, les alertes, la consommation de licences, les compteurs système et les performances des services dans un tableau de bord centralisé.
La console est devenue disponible avec WebADM 2.4.17. Elle a ensuite reçu des améliorations majeures dans la version 2.4.18 et d'autres améliorations de l'interface utilisateur dans la version 2.4.19. Autrement dit, elle n'est pas arrivée simplement, elle s'est rapidement perfectionnée.
Contrôle de mission pour votre environnement WebADM
La console de surveillance offre une vue d'ensemble de ce qui se passe sur WebADM et actualise les informations en temps réel. Considérez-la comme un centre de contrôle, moins le compte à rebours dramatique et les fauteuils pivotants compliqués.
À partir d'une seule page, les administrateurs peuvent :
- Suivre l'activité d'authentification sur les systèmes intégrés.
- Examiner l'utilisation et la capacité des licences du produit.
- Vérifiez la disponibilité des connecteurs configurés.
- Voir les logs d'authentification récents et les alertes actives.
- Suivre les compteurs opérationnels des services WebADM.
- Surveiller la latence et le débit des services clés et des backends de stockage.
Cela signifie moins de temps passé à demander : “ Sur quel écran était-ce ? ” et plus de temps à comprendre ce que la plateforme fait réellement.
Voir l'authentification en action
Les événements d'authentification sont beaucoup plus faciles à comprendre lorsqu'ils ne sont pas noyés dans un mur de texte.
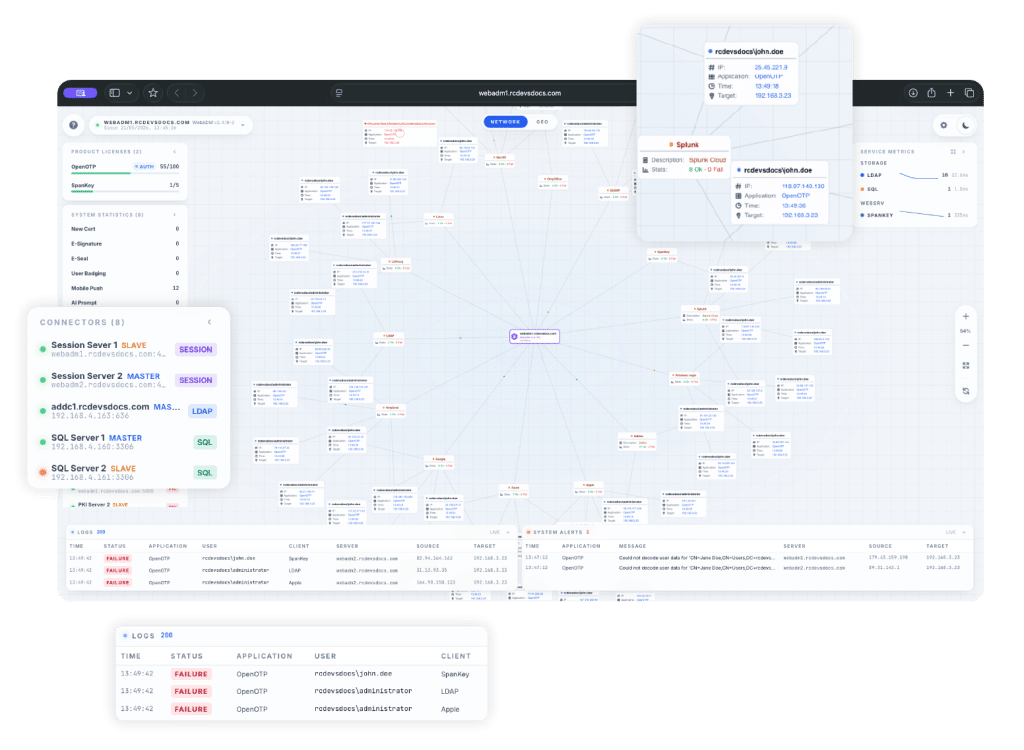
La console Vue réseau visualise les relations entre les sources d'authentification et les cibles. Il fournit une image en direct de la manière dont les requêtes circulent dans l'environnement, aidant les administrateurs à comprendre quels systèmes communiquent avec WebADM et où les requêtes sont traitées.
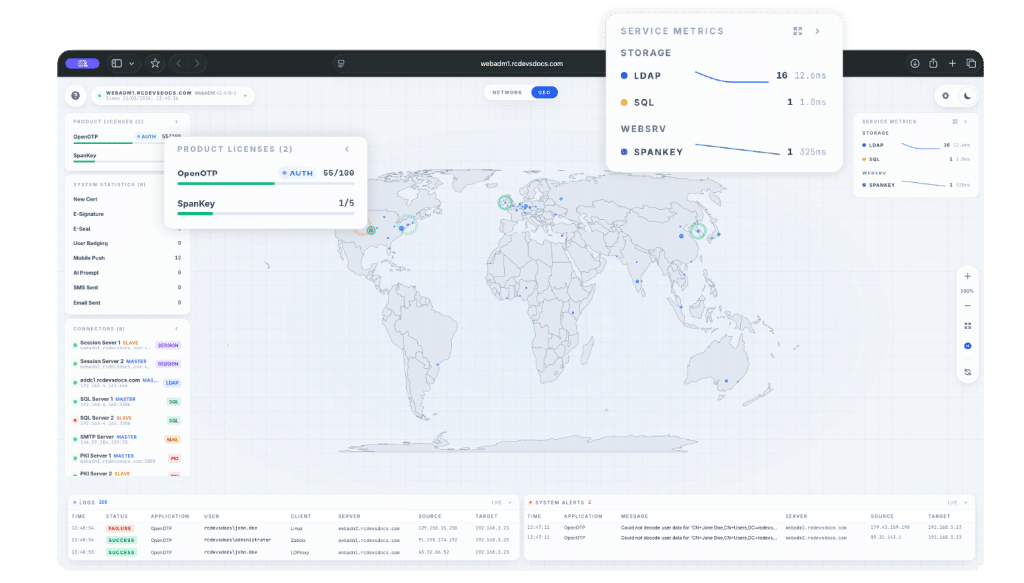
Passer à Vue géographique, et les sources de connexion peuvent être représentées sur une carte du monde. Cela rend l'activité géographique inhabituelle beaucoup plus facile à remarquer qu'elle ne le serait dans une entrée de journal traditionnelle.
Un détail important: la carte est utile, mais elle n'est pas psychique. Les adresses IP sources doivent être correctement transmises à OpenOTP par les systèmes clients intégrés, et l'activité en direct nécessite une politique client appropriée pour chaque système intégré.
Journaux qui racontent toute l'histoire
Le panneau de journaux en direct affiche les événements d'authentification récents ainsi que les détails dont les administrateurs ont besoin pour l'enquête : horodatage, statut, application, utilisateur, client, serveur, adresse IP source et cible.
Les requêtes réussies et échouées peuvent donc être examinées directement aux côtés du reste de la télémétrie de la plateforme. Aucune expédition de fichier journal séparée n'est requise.
La console affiche également les alertes de sécurité et de plateforme actives. Lorsque tout fonctionne correctement, le panneau d'alertes reste agréablement sans incident. Lorsqu'une intervention est nécessaire, les administrateurs peuvent immédiatement voir le contexte pertinent de l'application, du message, du serveur et du réseau.
Identifiez le maillon faible avant qu'il ne devienne une panne
Les environnements WebADM peuvent dépendre de plusieurs services connectés. La console de surveillance affiche des indicateurs d'état de fonctionnement (haut/bas) pour les éléments configurés :
- Serveurs de session
- LDAP répertoires
- Bases de données SQL
- Services SMTP
- Services PKI
- Connecteurs proxy
Le vert est rassurant. Le rouge est exploitable. Les deux sont plus utiles que de deviner.
La console fournit également des statistiques de latence et de débit pour les services OpenOTP et SpanKey, ainsi que pour les backends de stockage LDAP et SQL. Cela permet de voir plus facilement si un service répond normalement, si un backend ralentit ou si un connecteur est devenu indisponible.
Gardez un œil sur la capacité, et tout le reste
Le mode Licences de produit La section affiche la consommation actuelle par rapport à la capacité disponible pour les produits WebADM tels que OpenOTP et SpanKey. Les administrateurs peuvent voir quelle quantité de chaque licence est utilisée sans avoir à consulter une feuille de calcul ou à attendre une surprise de capacité au moment le moins opportun.
Le mode Statistiques du système La section fournit des compteurs d'activité sur la plateforme, notamment les certificats, les signatures électroniques, les sceaux électroniques, les notifications push mobiles, les messages SMS, les badges utilisateur et les rapports d'IA.
C'est une manière compacte de comprendre non seulement si WebADM est en cours d'exécution, mais aussi comment il est utilisé.
Facile d'accès, soigneusement protégé
Les administrateurs peuvent ouvrir la console de surveillance à partir du Surveillance dans le portail d'administration WebADM. Il est également possible d'y accéder directement via le système dédié /console/index.html point de terminaison.
L'accès direct ne nécessite pas de session sur le portail d'administration, mais il requiert une authentification valide via la console (token) avant que le flux en direct « Server-Sent Events » ne soit établi.
La console est désactivé par défaut. Pour l'activer, un administrateur doit configurer le console_tokens directive dans /opt/webadm/conf/webadm.conf puis redémarrez WebADM. Il est possible de configurer plusieurs token lorsque plusieurs consoles doivent y accéder.
Ce modèle d'accès est délibérément explicite car le tableau de bord peut afficher des informations opérationnelles sensibles, notamment les noms d'utilisateur, l'activité d'authentification, les adresses IP source, la géolocalisation et les métriques de plateforme.
Les codes token doivent donc être traités comme des secrets, renouvelés périodiquement et remplacés dès qu’un opérateur ayant connaissance d’un code token quitte l’organisation. L’accès à /console/* devrait également être limité aux administrateurs de confiance et aux réseaux de gestion.
Une console de surveillance doit améliorer la visibilité, pas devenir un divertissement public.
Pour commencer
Activer la console ne prend que quelques étapes :
- Exécutez WebADM 2.4.17 ou version ultérieure.
- Générer un nombre aléatoire fort de type token, par exemple avec
openssl rand -hex 16. - Ajoutez le token au
console_tokensdirective danswebadm.conf. - Redémarrer WebADM.
- Ouvrez l'onglet Monitoring ou l'URL directe de la console, et connectez-vous.
La procédure de configuration complète, y compris la prise en charge de plusieurs token et des deux méthodes de redémarrage de WebADM, est disponible dans le Documentation technique RCDevs.
Votre environnement WebADM a déjà un pouls. Maintenant, vous pouvez le voir.
La console de surveillance WebADM offre aux équipes de sécurité et d'exploitation une vision plus claire du trafic d'authentification, de l'état de la plateforme, des dépendances de l'infrastructure, de la capacité de licence et des performances du backend.
Que vous enquêtiez sur un échec de connexion, que vous vérifiiez la réactivité de LDAP, que vous examiniez une alerte ou que vous confirmiez simplement que tout fonctionne correctement, les informations sont déjà là, en temps réel et sur un seul écran.
Pas d'onglet Safari. Pas de journal d'archéologie. Juste une meilleure vue de WebADM.
Prêt à voir votre environnement en temps réel ? Explorez la console de surveillance WebADM, suivez guide de configuration technique ou contactez RCDevs pour demander une démonstration de faisabilité gratuite.